Analyzing the spatial and temporal dynamics of Snapchat
Levente Juhász and Hartwig Hochmair
![]()
June 12, 2018 @ VGI-ALIVE pre-conference workshop, AGILE 2018, Lund, Sweden
Instant messages called "Snaps"

- Peer-to-peer
- Disappear upon viewing
© Santeri Viinamäki CC BY-SA
Instant messages called "Snaps"

- Peer-to-peer
- Disappear upon viewing
© Jamie CC BY-NC-SA
Snap stories
- Sequence of snaps
- Available to view for friends
- Available for 24 hrs
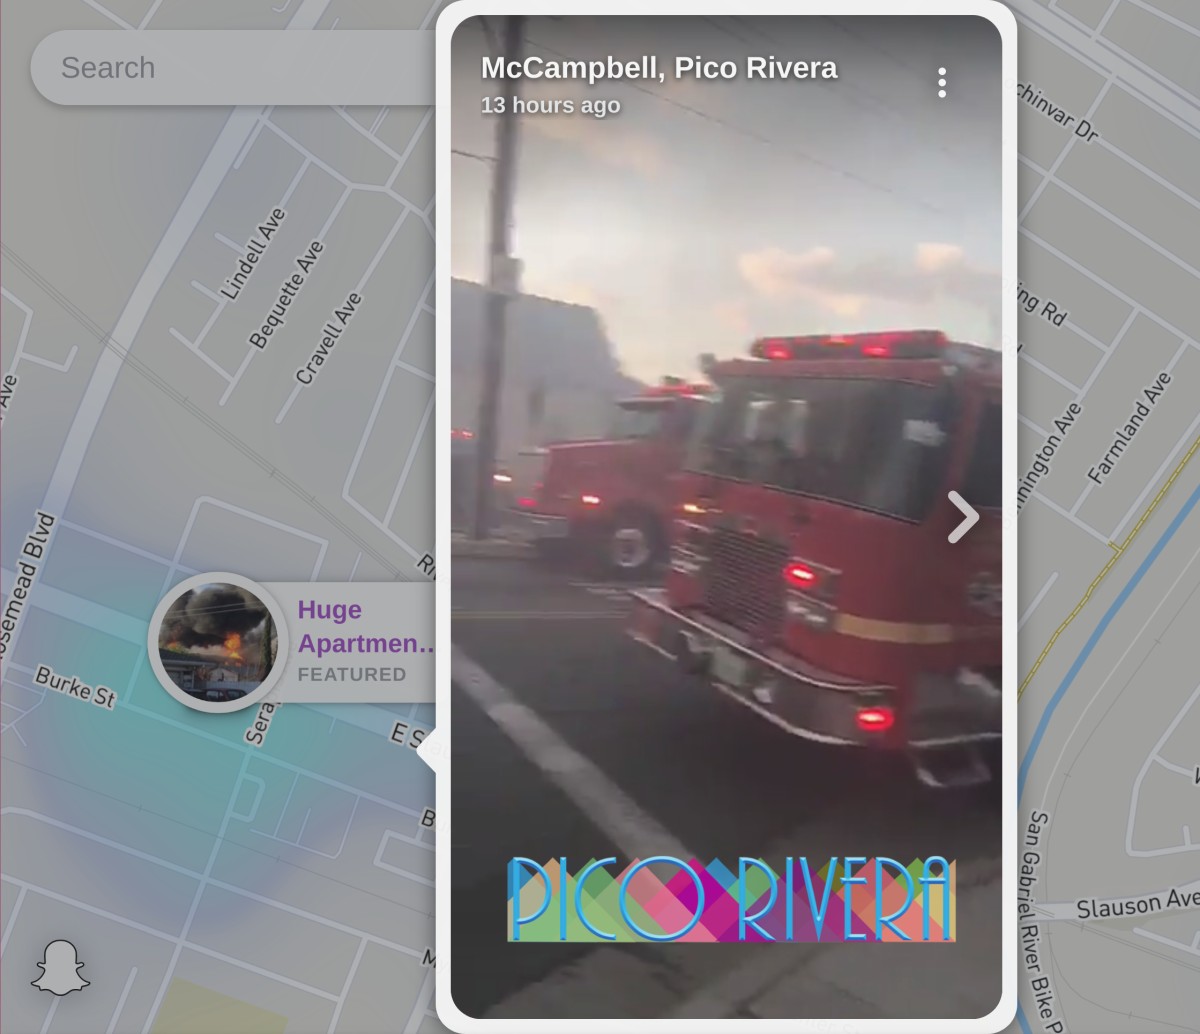
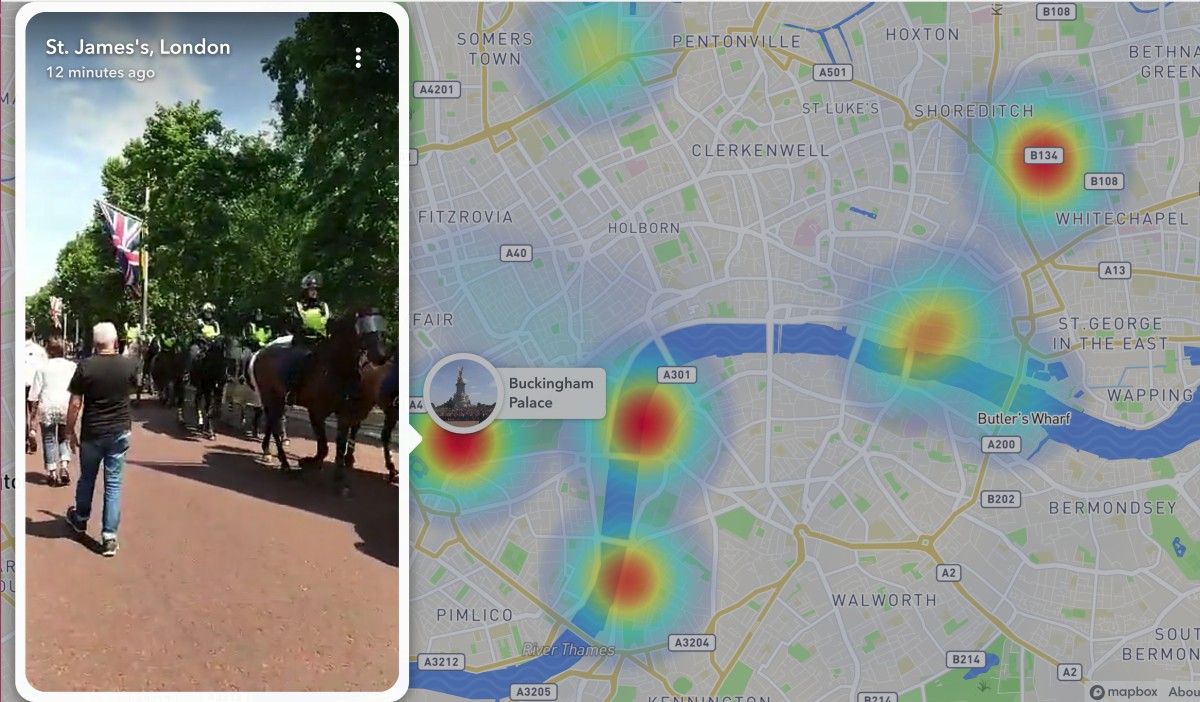
Snap Map
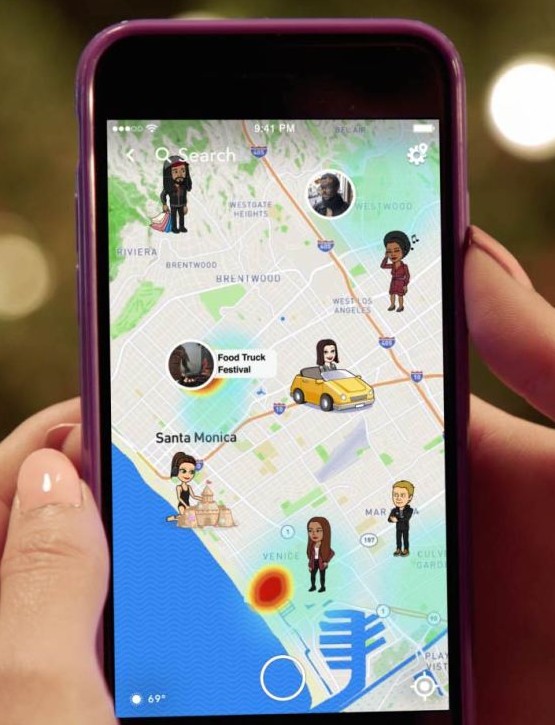
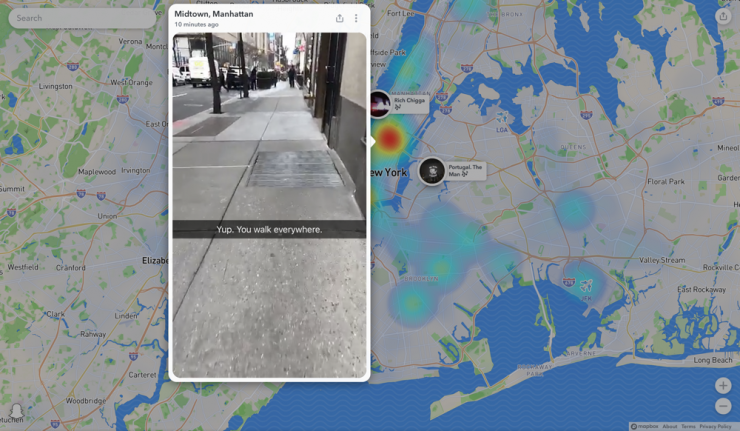 Location sharing + publicly available snaps
Snapchat by the numbers
- 190 million active daily users
- 300 million active monthly users
- 47% of US teens consider it their main social media
- More than 20k photos/videos per second
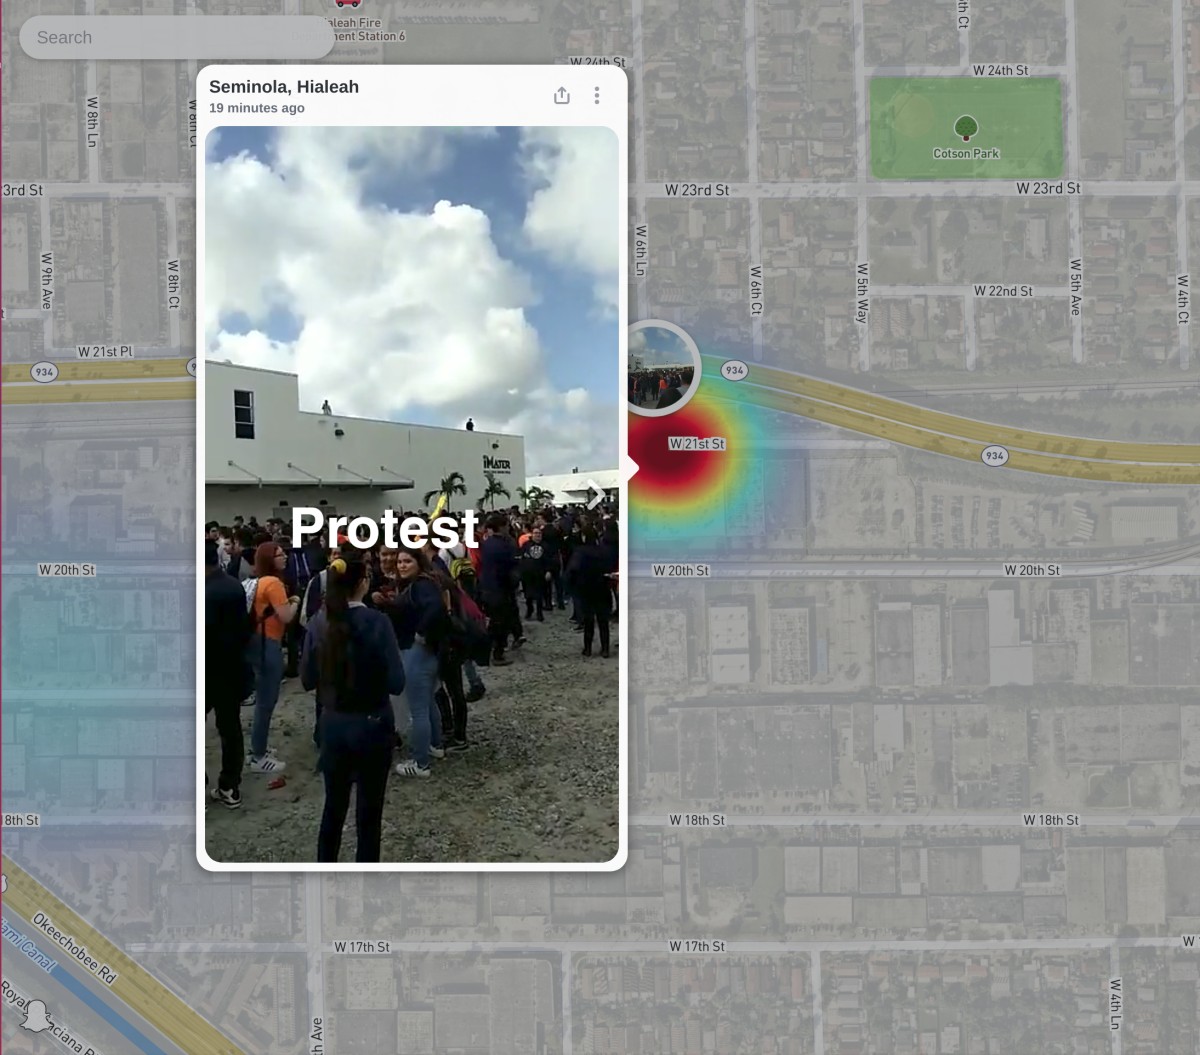
Is Snapchat of interest?
First hand information
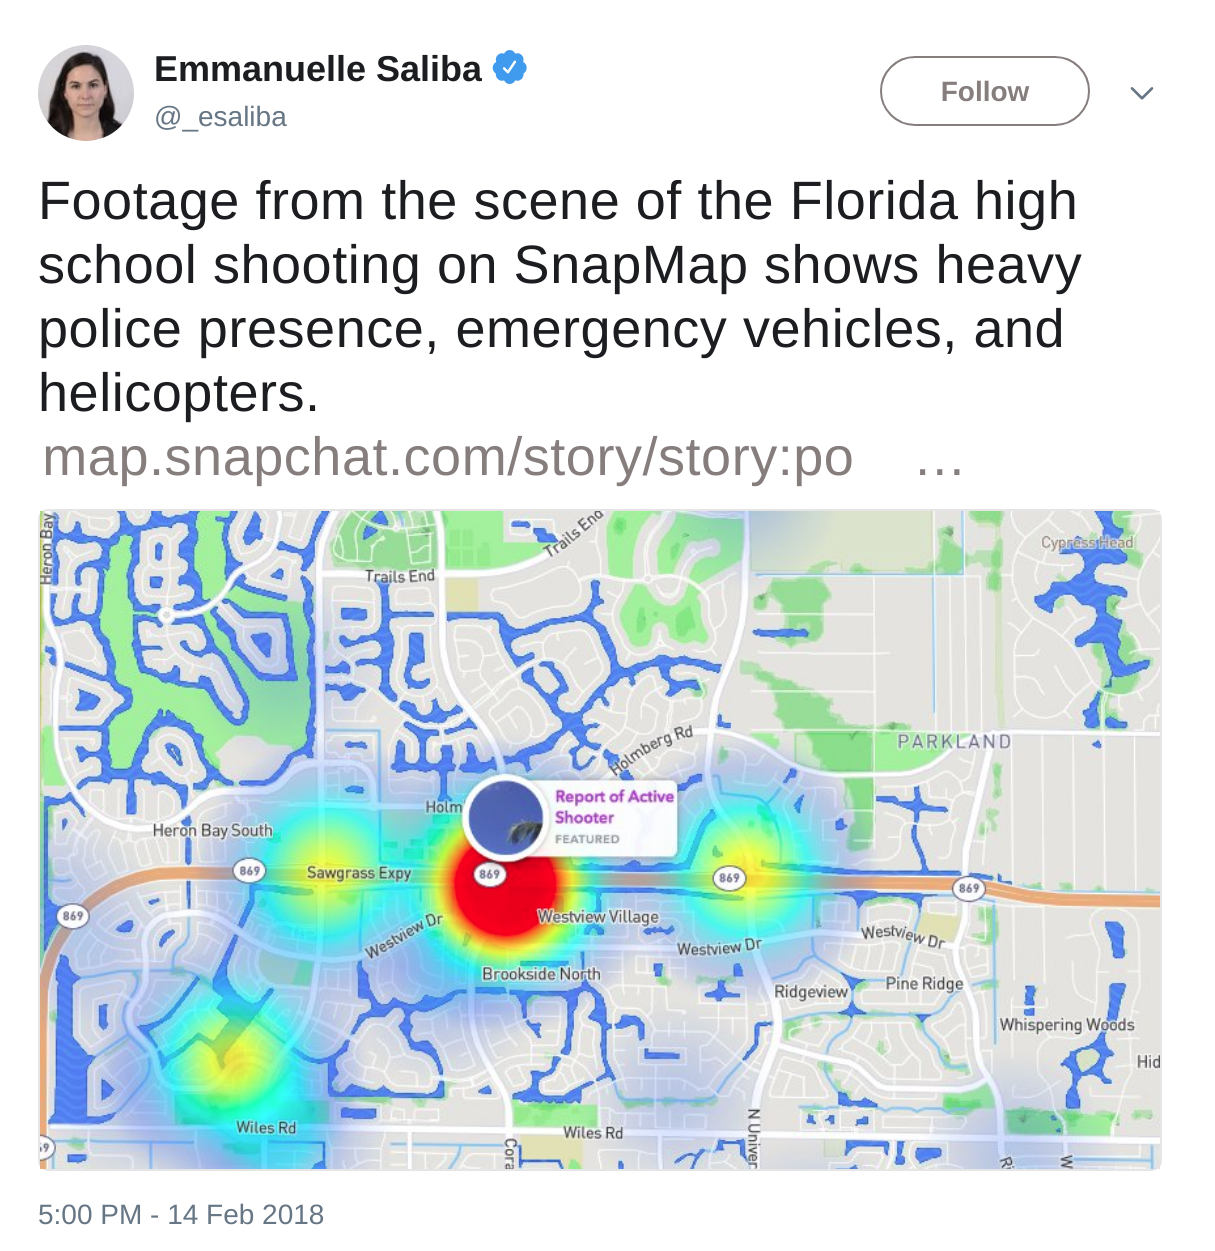
Is Snapchat of interest?
Near real-time event detection
Goal: Understand the spatial and temporal characteristics of Snapchat
To see what kind of information can be expected
Data collection
Data collection
- Before February 2018
- Mobile only app
- No open API
- Can be reverse engineered
- Public snaps on map can be collected
Snap Map available at map.snapchat.com (Feb '18)
Data collection
Data collection
- Heatmap from points corresponding to snaps
- Regenerated every ~5 mins
- Individual points visible for 24 hrs
- Scrape locations continuously
- Rebuild timeline and keep first occurence of points
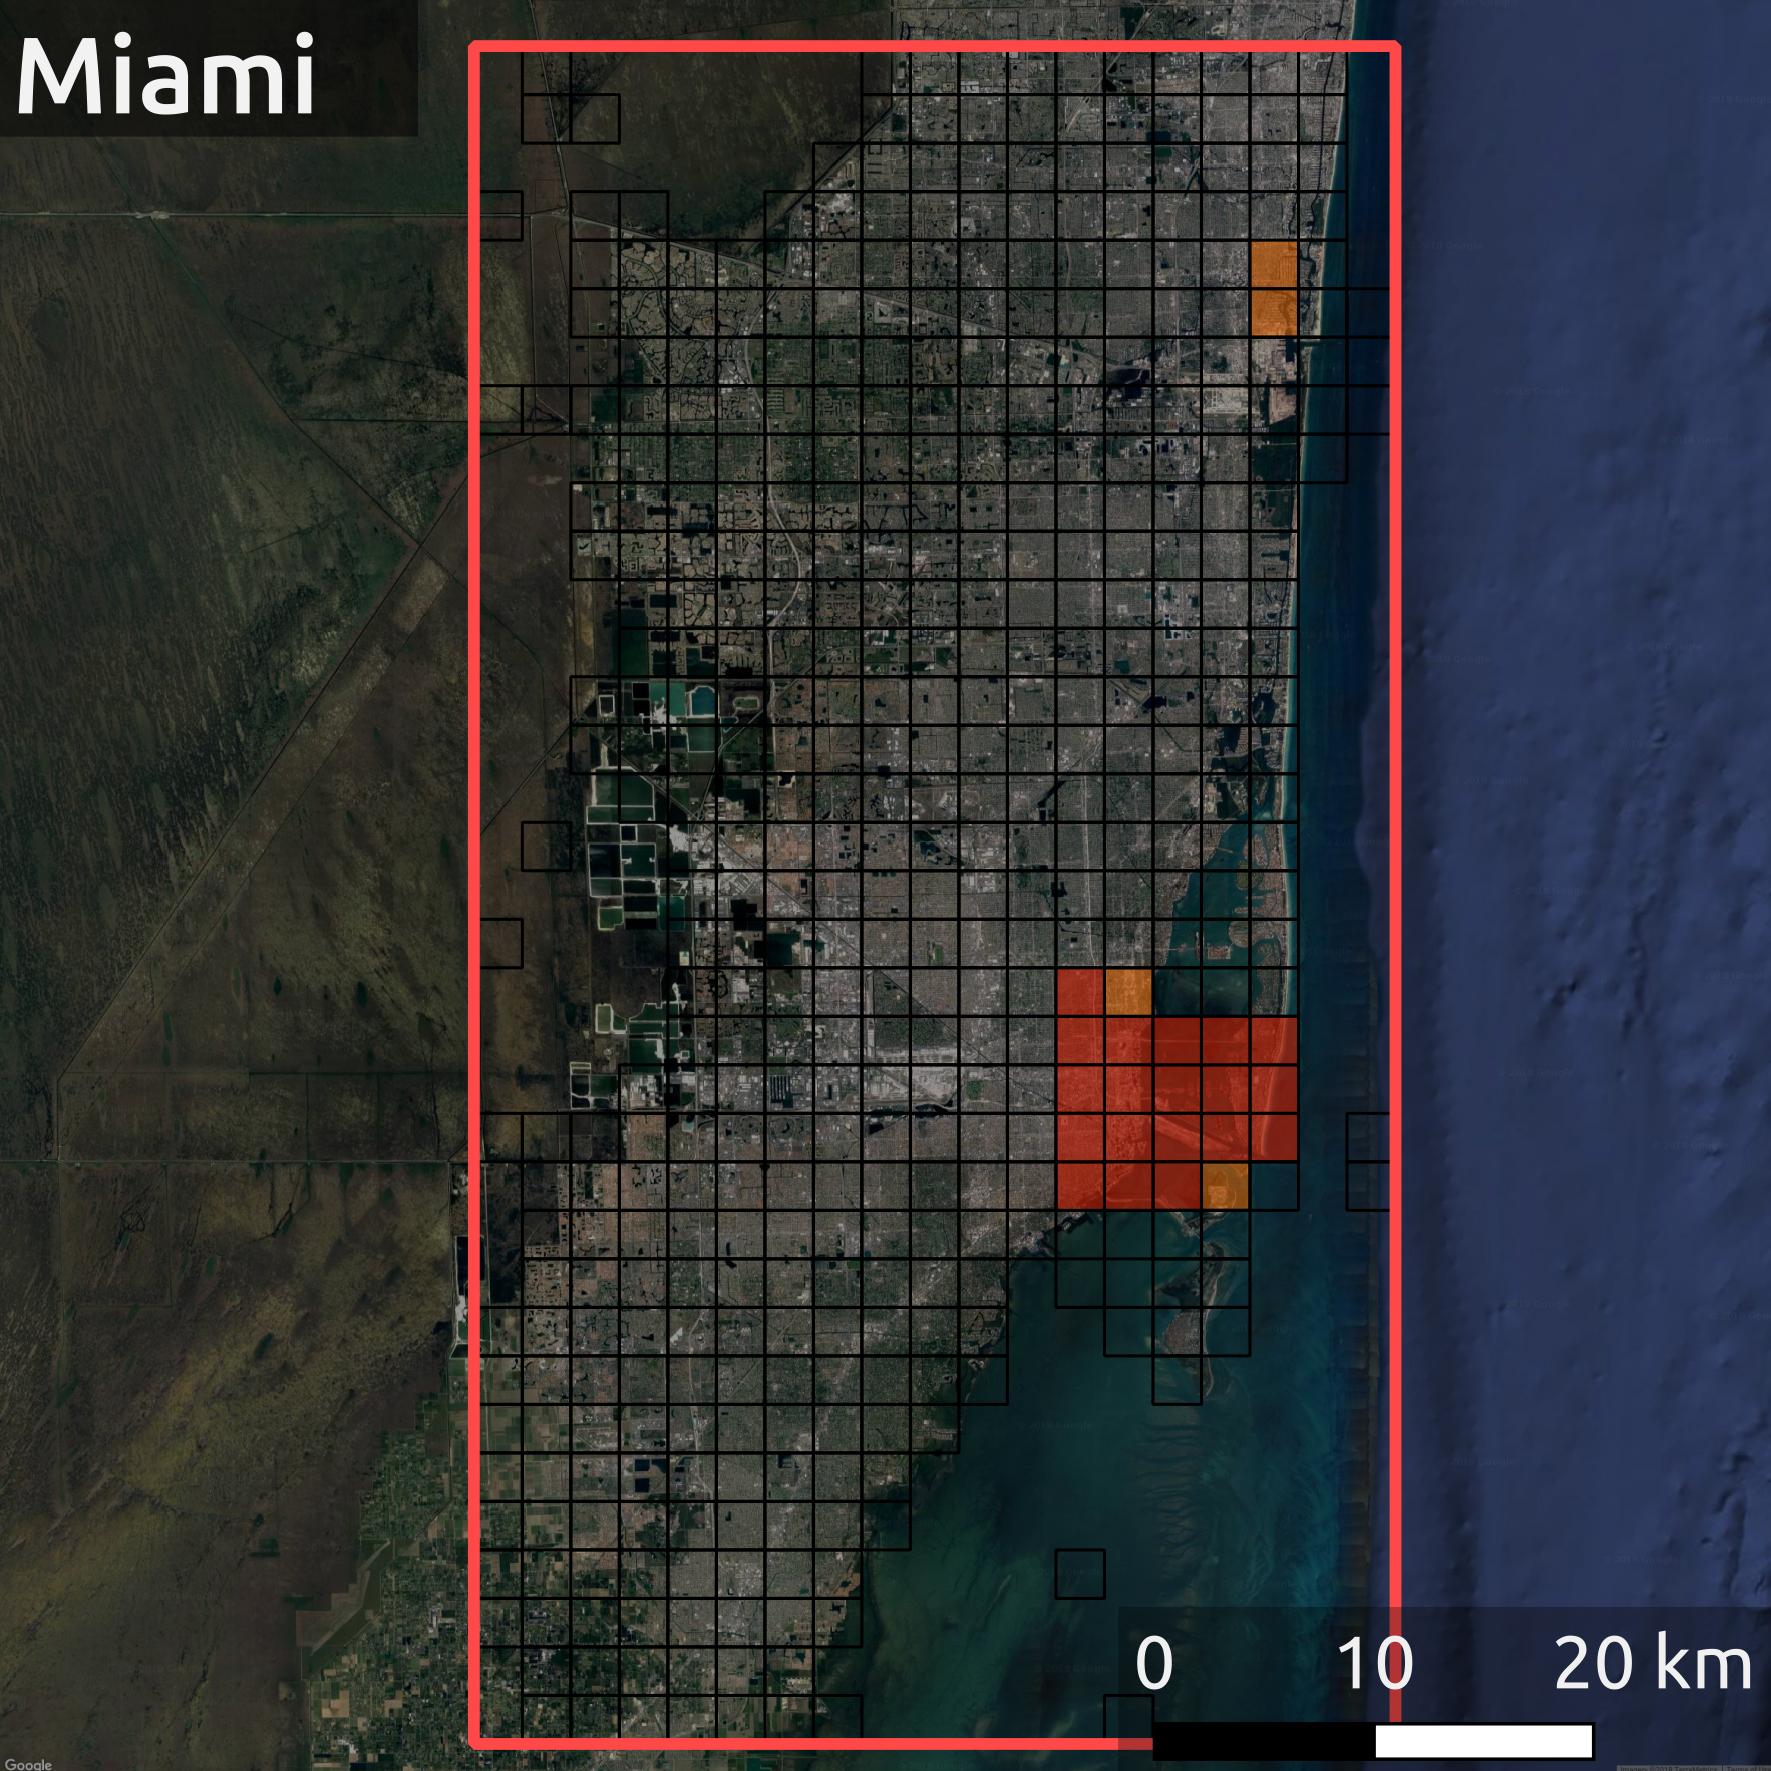
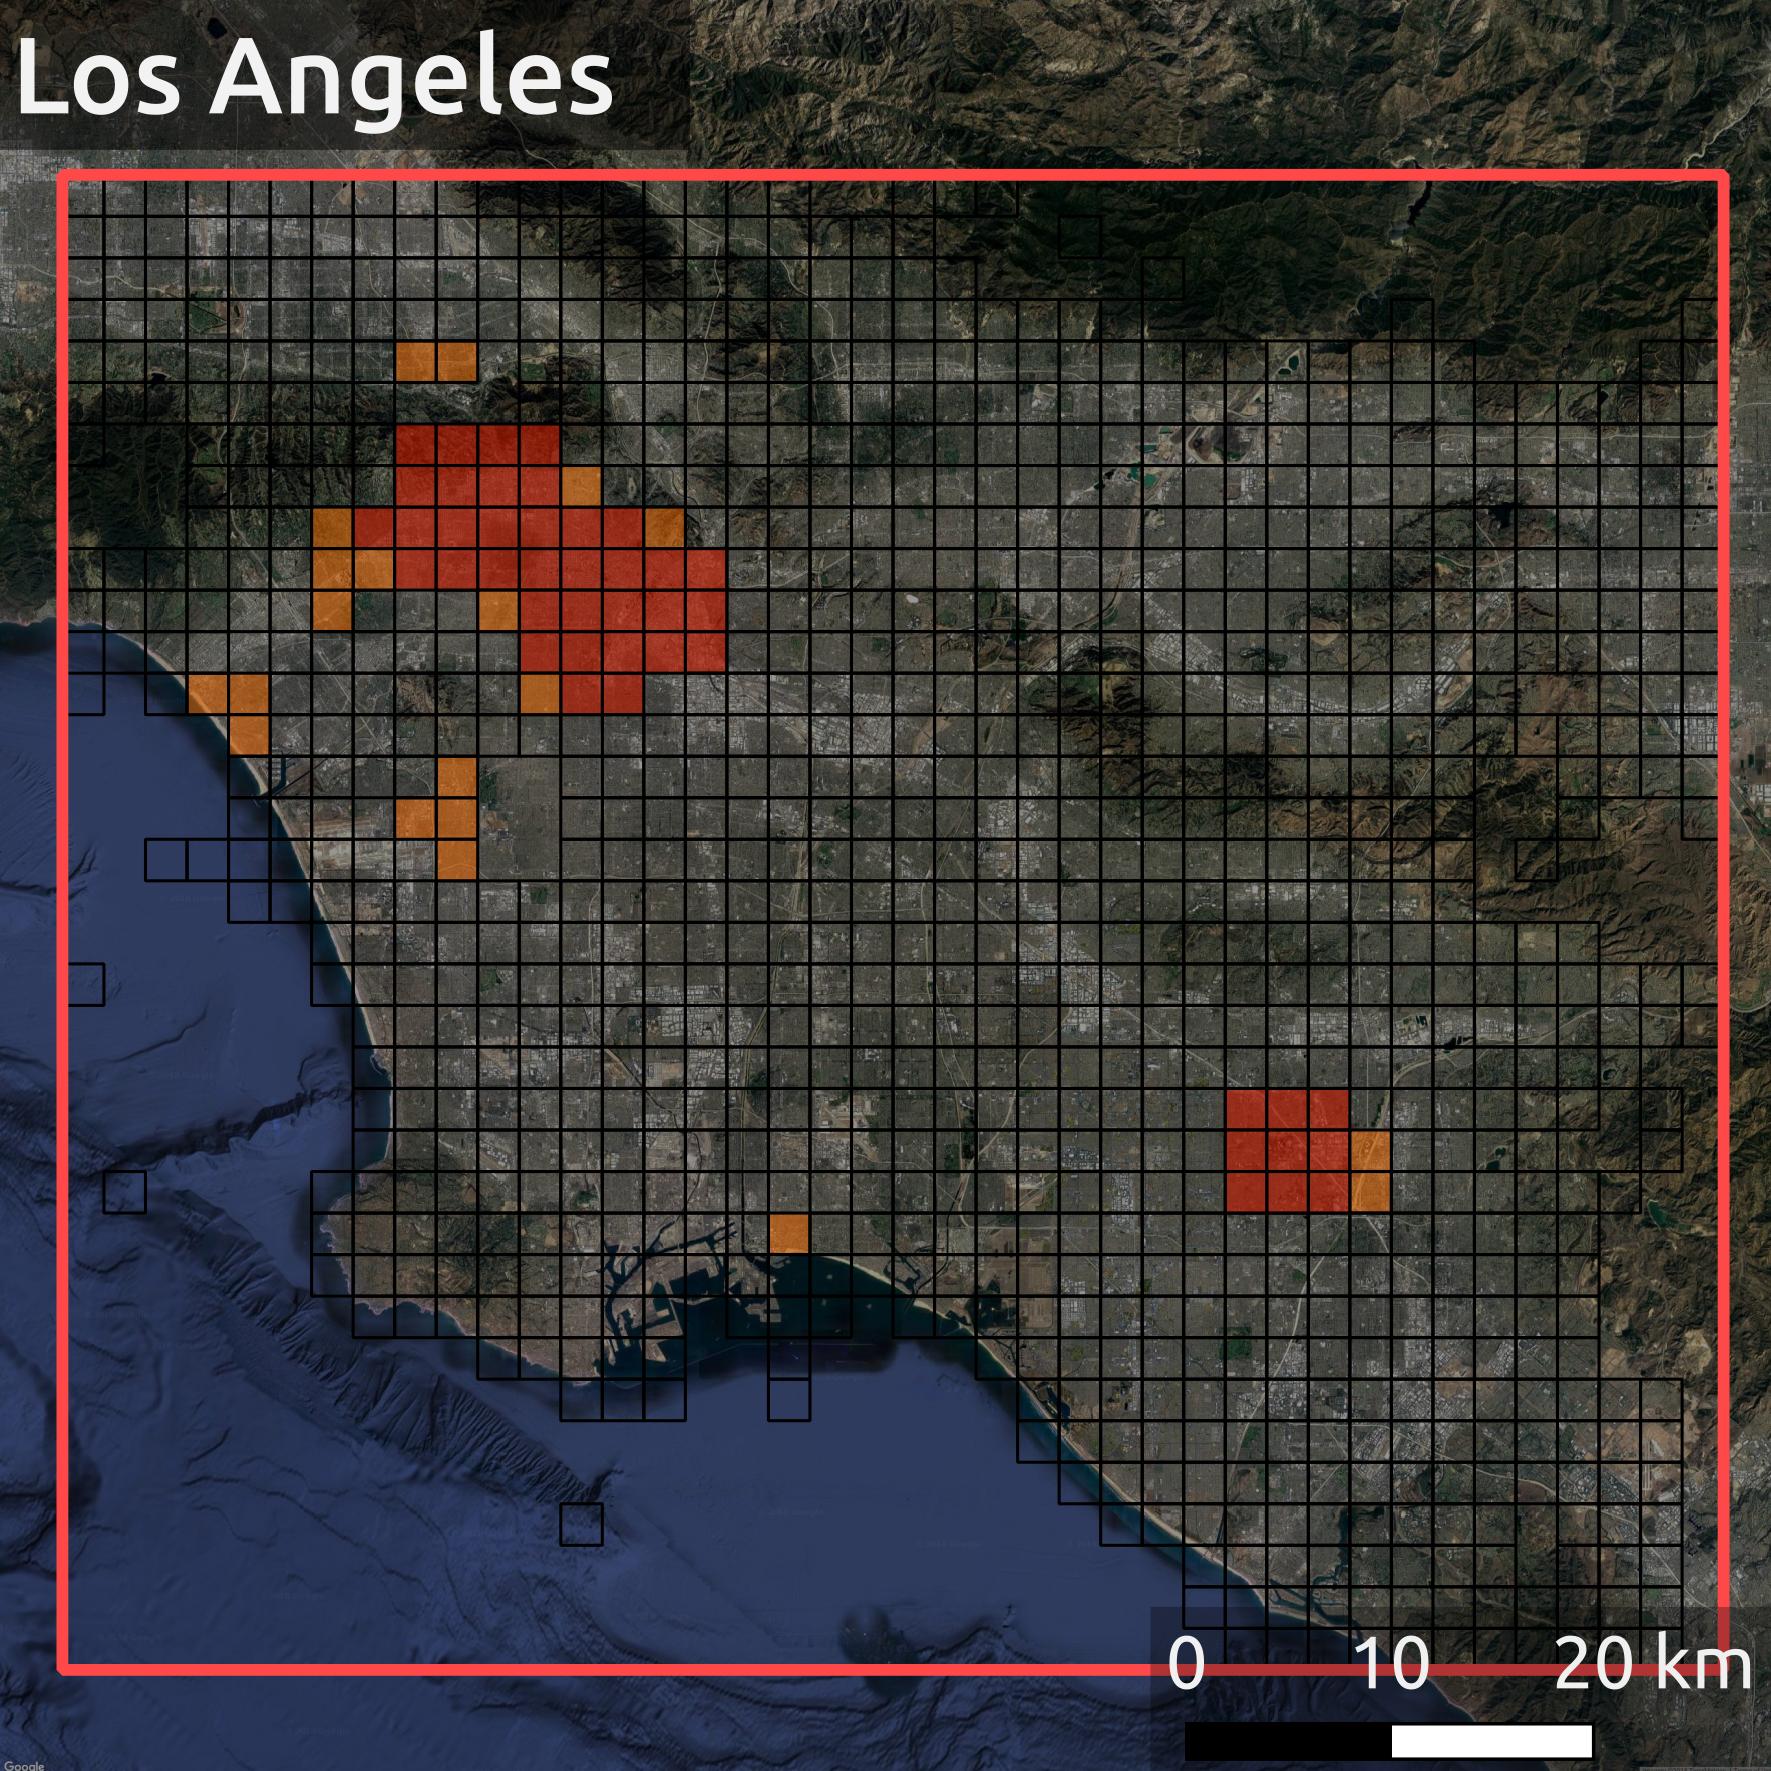
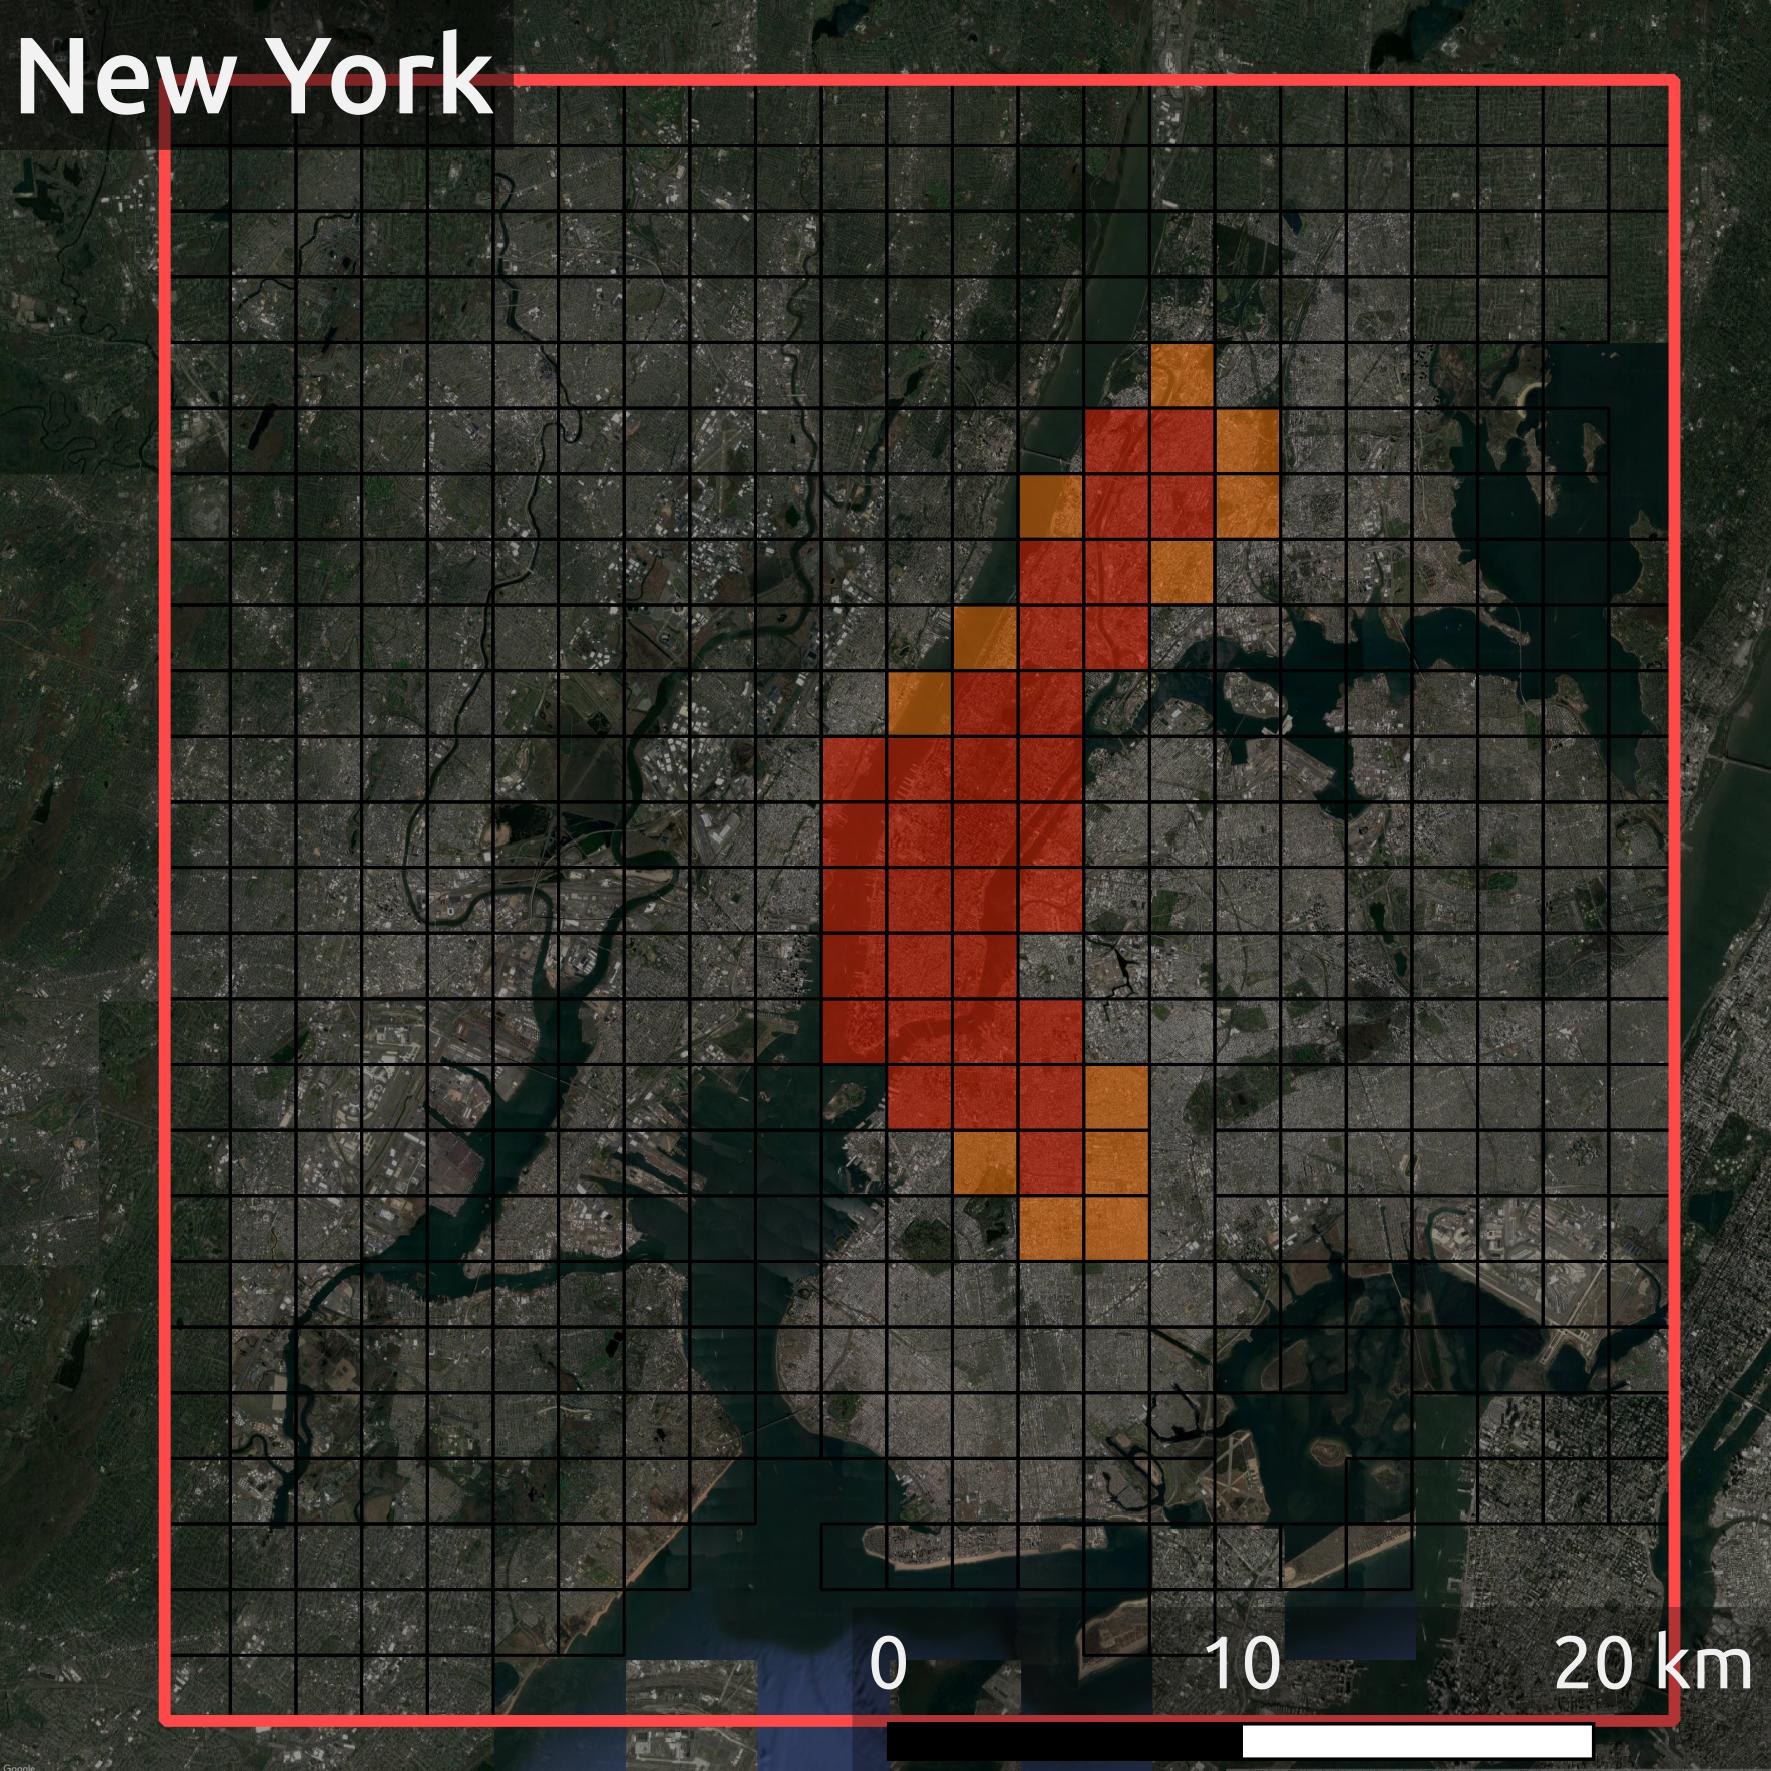
- Miami, New York City and Los Angeles
- February 23 - March 3
Data collection
| Metro area | # of tiles (area [sq km]) | # of snaps |
|---|---|---|
| Miami | 457 (2,860) | 25,155 |
| Los Angeles | 1,029 (6,395) | 77,426 |
| New York | 514 (3,105) | 54,243 |
Results
Spatial characteristics
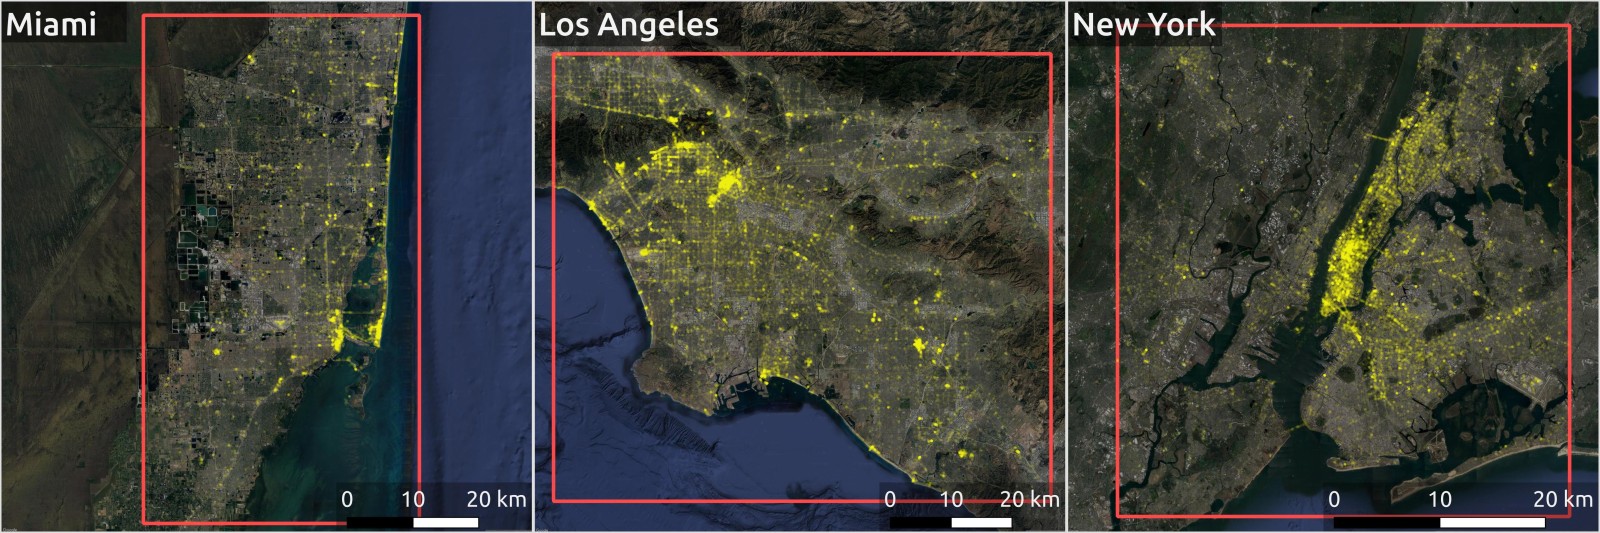
Prominence of downtown areas with other local clusters
Spatial characteristics
Tile size: ~ 2.4 km x 2.4 km
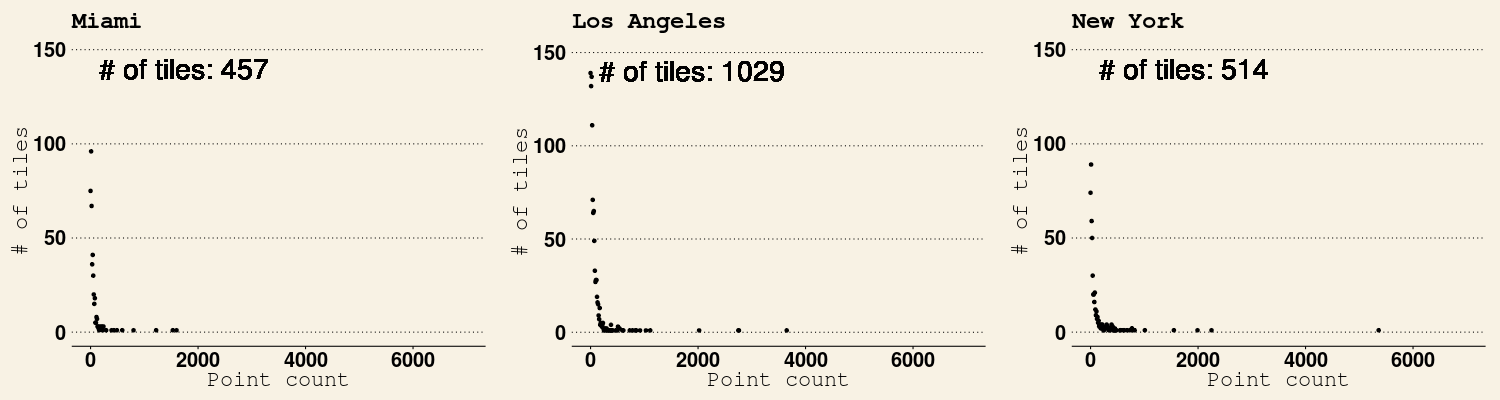
25% of snaps are posted in 1% of tiles
Spatial characteristics
Gi* statistics
Temporal characteristics
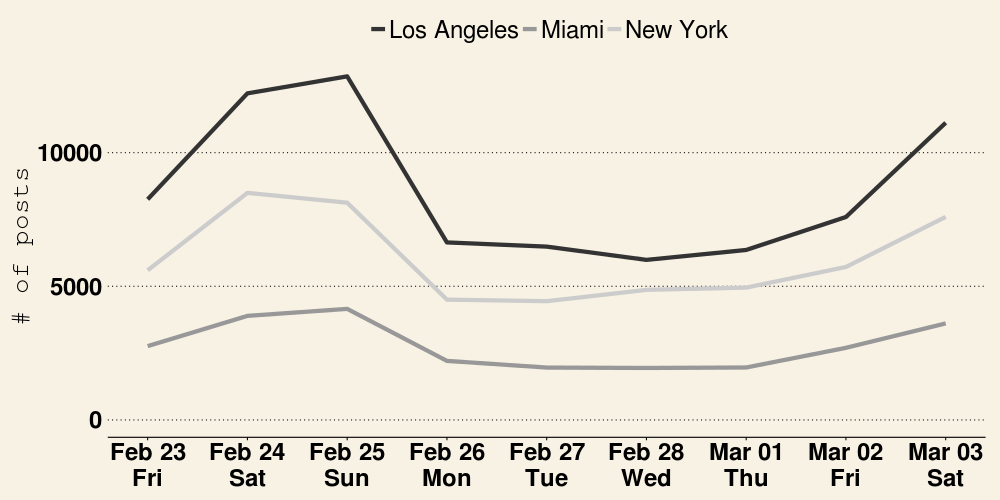
Snap numbers increase by 61-75% over the weekend
Temporal characteristics
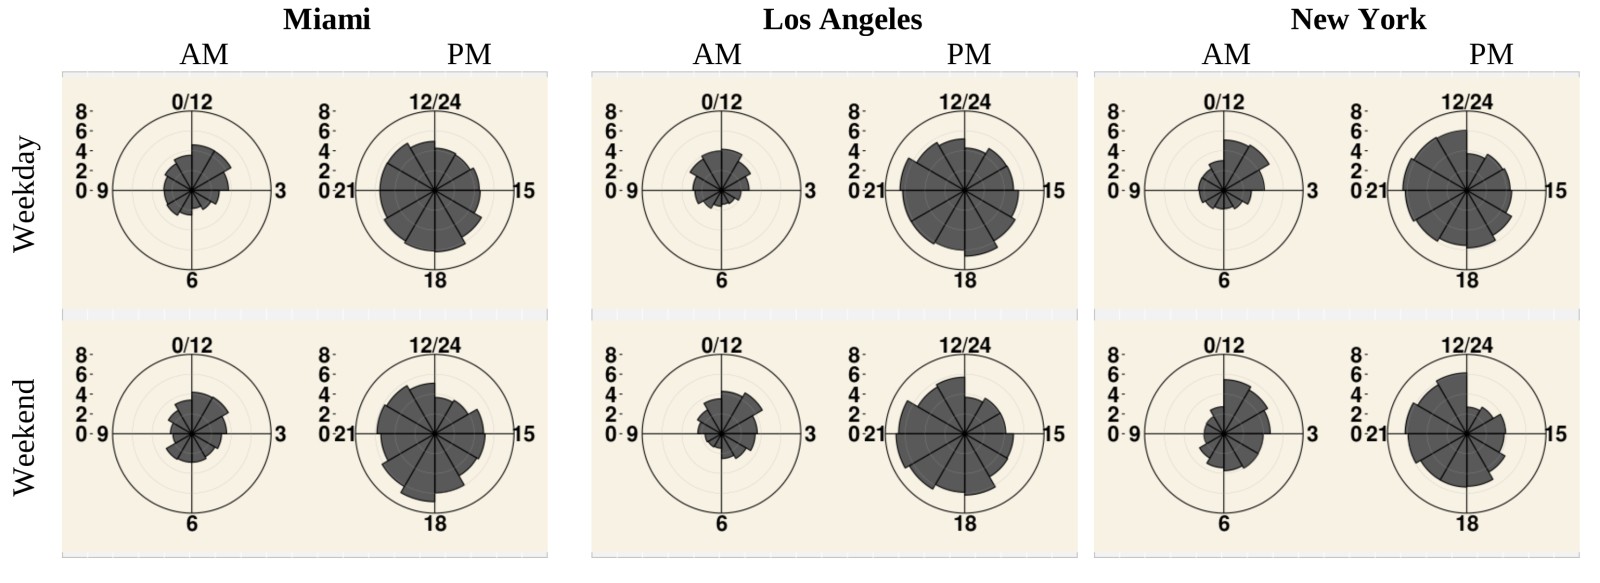
Temporal characteristics
Weekday| Miami | Los Angeles | New York | |
|---|---|---|---|
| Most active | 17-18 | 17-18 | 21-22 |
| Least active | 5-6 | 5-6 | 5-6 |
| Miami | Los Angeles | New York | |
|---|---|---|---|
| Most active | 18-19 | 20-21 | 21-22 |
| Least active | 8-9 | 6-7 | 9-10 |
Summary
Summary
- Snapchat is used to gather first hand information
- Strong clusters in downtown and touristic areas
- Weekend activity > weekday activity
- Peak: evening and night; Least active: early morning
- Longer period, more cities
- Compare activity to Twitter
Future work:
Questions?

Need volunteers for other research: research.jlevente.com